
There is a particular kind of performance bug that does not show up in unit tests, does not trigger any warnings, and produces perfectly correct results. It is the kind where your code does exactly what you asked, and your hardware does exactly what it is told, and the two of them are leaving an order-of-magnitude speedup on the table because nobody introduced them properly.
Turbopuffer found one of these in February. A customer query that should have taken 50 milliseconds was taking 220. The BM25 ranking engine was fine. (BM25 is the standard algorithm behind full-text search. Given a query, it scores every document by how often the search terms appear, how rare those terms are across the corpus, and how long the document is. It is the reason search engines return relevant results instead of random ones. Elasticsearch uses it. Lucene uses it. Turbopuffer uses it.) The filter evaluation was the problem. A merge iterator processing 100,000 integers was taking 6.5 milliseconds when napkin math said it should take 130 microseconds.
The code was correct. The abstraction was zero-cost. The hardware was fast. And yet.
The Rust version of the problem
Rust’s Iterator trait is one of the language’s best ideas. It composes beautifully. It optimizes well. And the Rust community will tell you, with justified pride, that it compiles down to the same machine code as a hand-written loop. Zero-cost abstraction. You get the ergonomics of functional programming with the performance of C.
This is true. It is also, in the way that matters, incomplete.
The problem is not that Iterator::next() has overhead. It does not. The problem is that each call to next() is a black box to the compiler. The function returns one value, mutates some internal state, and the compiler has no guarantee about what happens next. It cannot see that the next hundred thousand calls will walk a contiguous array in order. It cannot prove that there are no side effects between iterations. And without those guarantees, it cannot vectorize.
SIMD (Single Instruction, Multiple Data) is how modern processors actually get fast. Instead of processing one integer per cycle, the hardware processes four, eight, sixteen at once. The same comparison, the same addition, applied to a whole vector of values in a single instruction. But the compiler can only emit these instructions when it can see the full loop: the iteration count, the memory access pattern, the absence of dependencies between iterations.
Iterator::next() hides all of that behind a function call. The abstraction is zero-cost per invocation. But the cost of the abstraction is not in the call. It is in the optimization it prevents.
Here is what the scalar iterator looks like in Rust, simplified:
// One element at a time. The compiler sees a function boundary.
while let Some(key) = merge_iter.next() {
    if filter.contains(key) {
        count += 1;
    }
}
Each call to next() recurses down through the merge tree, produces one key, mutates state, and returns. The compiler dutifully generates a tight scalar loop. Seven instructions per element on ARM. Four for the body, three for loop control. The hardware does exactly what it is told.
Turbopuffer’s fix was to batch. The change looks almost trivial:
// 512 elements at a time. The compiler sees a vectorizable loop.
while let Some(batch) = merge_iter.next_batch() {
    for key in batch.iter() {
        if filter.contains(*key) {
            count += 1;
        }
    }
}
The outer loop amortizes the merge cost across 512 elements. The inner loop is a contiguous array traversal with no function calls, no state mutations, no dependencies between iterations. The compiler sees it, recognizes it, and vectorizes it. On ARM, LLVM aggressively auto-vectorizes this to NEON SIMD. Multiple values per instruction instead of one. The code got less elegant and 4.7 times faster. Latency dropped from 220 milliseconds to 47.
On ARM, batching is the fix. Expose the loop structure, and the compiler does the rest.
We wanted to know if the same trick works on different silicon.
The same benchmark on RISC-V
I work on edge AI accelerators. RISC-V cores with vector extensions. The kind of hardware where every cycle counts because the power budget is measured in milliwatts, not kilowatts.
When I read the turbopuffer article, the obvious question was: does batching work on RISC-V the way it works on ARM? So we ran the same experiment on a 64-bit RISC-V core with 32-bit vector extensions (RVV, zve32f subset), running at 245.76 MHz. Not a simulator. Real silicon. The actual BM25 algorithm, scoring 20,000 documents against a single query term.
The BM25 inner loop computes:
score = idf * (tf * (k1+1)) / (tf + k1 * (1 - b + b * dl/avgdl))
A chain of float multiply, add, and divide operations over contiguous arrays of term frequencies and document lengths. Exactly the kind of workload that should vectorize well.
Three implementations. Same math. Same data. Same silicon.
Version one: scalar. Straightforward C loop. One document at a time. Load two floats, compute the BM25 formula, store the result. Repeat 20,000 times. The disassembled inner loop from the actual binary:
.L_scalar:                       # @0x2bae in Demo.elf
  flw   fa1, 0(a3)              # load dl[i]
  flw   fa0, 0(a4)              # load tf[i]
  fdiv.s  fa1, fa1, fa3         # dl / avgdl
  fmul.s  ft0, fa0, fa5         # tf * (k1+1)
  fmul.s  ft0, ft0, fa4         # * idf
  fmadd.s fa1, fa1, fa2, fs0    # b/avgdl*dl + (1-b)
  fmadd.s fa1, fa1, fs1, fa0    # k1*norm + tf
  fdiv.s  fa1, ft0, fa1         # score = num / den
  fsw     fa1, 0(a2)            # store score
Nine scalar float instructions per document. Two loads, two divisions, two multiplies, two fused multiply-adds, one store. The vector unit on the same die does nothing.
Version two: batched. Same math, reorganized into a fixed 512-element inner loop. This is the turbopuffer fix. On ARM, this is where LLVM sees the contiguous loop and auto-vectorizes it to NEON. We compiled with the vector extension enabled and auto-vectorization on. The disassembly:
.L_batched:                      # @0x2c60 in Demo.elf
  flw     fa2, 0(a3)            # load dl[i]
  flw     fa3, 0(s0)            # load tf[i]
  fmadd.s fa2, fs2, fa2, fs0    # b/avgdl*dl + (1-b)
  fmul.s  fa1, fa3, fa5         # tf * (k1+1)
  fmadd.s fa3, fa2, fs1, fa3    # k1*norm + tf
  fmul.s  fa1, fa1, fa4         # * idf
  fdiv.s  fa3, fa1, fa3         # score = num / den
  fsw     fa3, 0(a4)            # store score
Eight scalar float instructions. No v prefix anywhere. The compiler saw the 512-element loop, decided it could not vectorize it for zve32f, and emitted the same scalar code as version one. On ARM, this exact pattern gives turbopuffer 60x. Here, 1.02x.
Version three: explicit RVV intrinsics. Hand-written RISC-V Vector code. vsetvli to set the vector length, vfmul.vf and vfadd.vf for the BM25 math, vfdiv.vv for the division, all at LMUL=4 for maximum throughput:
while (pos < n) {
    size_t vl = __riscv_vsetvl_e32m4(n - pos);

    vfloat32m4_t v_tf = __riscv_vle32_v_f32m4(&tf[pos], vl);
    vfloat32m4_t v_dl = __riscv_vle32_v_f32m4(&dl[pos], vl);

    // norm = k1 * (1-b + b/avgdl * dl)
    vfloat32m4_t v_norm = __riscv_vfmul_vf_f32m4(v_dl, boa, vl);
    v_norm = __riscv_vfadd_vf_f32m4(v_norm, omb, vl);
    v_norm = __riscv_vfmul_vf_f32m4(v_norm, k1, vl);

    // numerator = idf * (k1+1) * tf
    vfloat32m4_t v_num = __riscv_vfmul_vf_f32m4(v_tf, idf_k1p1, vl);

    // denominator = tf + norm
    vfloat32m4_t v_den = __riscv_vfadd_vv_f32m4(v_tf, v_norm, vl);

    // score = num / den
    vfloat32m4_t v_score = __riscv_vfdiv_vv_f32m4(v_num, v_den, vl);

    __riscv_vse32_v_f32m4(&out[pos], v_score, vl);
    pos += vl;
}
All three produce identical results. Zero mismatches, verified.
The compiler turns this into a tight vector loop. From the actual disassembly:
.L_rvv:                          # @0x2d36 in Demo.elf
  vsetvli a2, a2, e32, m4, ta, ma  # set vector length
  vle32.v v8, (a0)              # load dl[] vector
  vfmul.vf v8, v8, fs2          # b/avgdl * dl
  vfadd.vf v8, v8, fs0          # + (1-b)
  vle32.v v12, (a3)             # load tf[] vector
  vfmul.vf v8, v8, fs1          # * k1  (norm complete)
  vfmul.vf v16, v12, fa5        # tf * idf*(k1+1)  (numerator)
  vfadd.vv v8, v12, v8          # tf + norm  (denominator)
  vfdiv.vv v8, v16, v8          # score = num / den
  vse32.v v8, (a0)              # store scores
Ten vector instructions. Two loads, three multiplies, two adds, one divide, one store, one vsetvli. Each processes multiple documents per cycle. The entire BM25 formula in one pass through the vector pipeline.
The results
We measured on bare metal under FreeRTOS. Each variant ran 100 times. We report the best cycle count, read from the mcycle CSR. Results extracted over JTAG. No UART overhead in the measurement path.
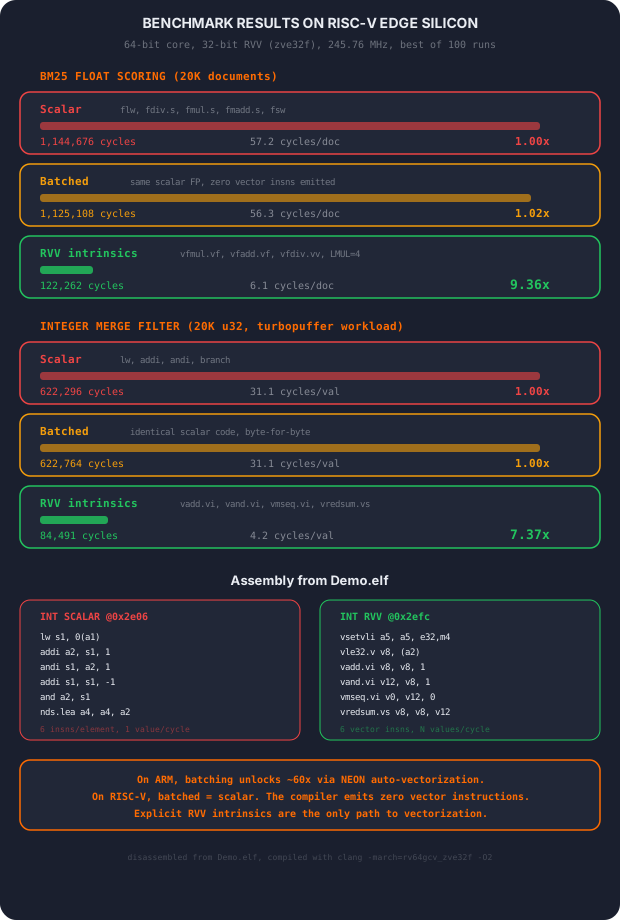
| Method | Cycles | Cycles/doc | Speedup |
|---|---|---|---|
| Scalar | 1,144,676 | 57.2 | 1.00x |
| Batched | 1,125,108 | 56.3 | 1.02x |
| RVV intrinsics | 122,262 | 6.1 | 9.36x |
Look at that middle row. Batched: 1.02x. Essentially no improvement.
On ARM, the same batching pattern gives turbopuffer roughly 60x because LLVM aggressively auto-vectorizes the inner loop to NEON SIMD instructions. On RISC-V with zve32f, Clang produces zero vector instructions for the batched version even with auto-vectorization enabled. We verified by disassembling the binary. The batched loop compiles to identical scalar flw/fmul.s/fdiv.s code. The compiler sees the loop structure. It just does not know what to do with it.
The explicit RVV intrinsics are the only path to vectorization on this target. The 9.4x speedup comes entirely from hand-written vector code processing multiple documents per cycle.
What the numbers tell us
The turbopuffer narrative is: expose the loop structure and the compiler will vectorize it. On ARM, this is true. LLVM’s NEON auto-vectorizer is mature, battle-tested, and aggressive. Batching works because the toolchain meets you halfway.
On RISC-V, the toolchain is not there yet. The vector extension is relatively new. The auto-vectorizer does not handle the RVV instruction set with the same confidence it handles NEON or AVX. Even when you hand it a perfect inner loop on a silver platter, it shrugs and emits scalar code.
This is not a criticism of the ISA. RISC-V Vector is a well-designed extension, and the 9.4x with explicit intrinsics proves the hardware can deliver. The silicon we tested is an earlier generation with the 32-bit vector subset (zve32f), not the full 64-bit RVV 1.0 that newer cores ship with. A more recent target with wider vectors and a more mature LLVM backend might auto-vectorize where ours did not. But that is precisely the point. The assumption that compiler optimizations are portable across architectures, across ISA subsets, across toolchain versions, is the abstraction that costs you. A pattern that unlocks 60x on ARM with a battle-tested NEON backend does nothing on an edge RISC-V core where the auto-vectorizer has not caught up to the hardware.
The float division chain is also revealing. BM25 requires a per-document division, and vfdiv is the bottleneck in the RVV version. The 9.4x speedup is less than the theoretical maximum because vector division throughput, not memory bandwidth, is the limiting factor. Even when you vectorize perfectly, the physics of the arithmetic unit sets the ceiling.
The integer version tells the same story
To make the comparison with turbopuffer fairer, we also ran their actual workload pattern: integer arithmetic on 20,000 values. Increment, check if even, conditional sum. No float. No division. Pure ALU work.
| Method | Cycles | Speedup |
|---|---|---|
| Scalar | 622,296 | 1.00x |
| Batched | 622,764 | 1.00x |
| RVV intrinsics | 84,491 | 7.37x |
Batched is 1.00x. Not 1.02x. Not 1.04x. Exactly the same. The compiler produces byte-for-byte identical code for the scalar and batched versions. On ARM, this same batching pattern gives turbopuffer roughly 60x.
The 7.4x RVV speedup on integers is less than the 9.4x on BM25 floats, which is counterintuitive. Integer ops should be cheaper. But the integer version requires a masked reduction (vredsum) per vector iteration to accumulate the conditional sum, while the BM25 version just stores results directly. The reduction serializes part of the pipeline. Even with explicit vector intrinsics, the shape of the algorithm matters.
Two different workloads. Two different data types. Same conclusion: on this RISC-V target, the compiler will not auto-vectorize for you. The abstraction tax is not a percentage. It is a wall.
Why this matters at the edge
On a server with thermal headroom and a generous power budget, the difference between the scalar and vector versions is a performance number on a dashboard. Interesting. Worth fixing if a customer complains.
On an edge device, it is the difference between shipping and not shipping.
Edge inference runs on power budgets measured in milliwatts. Every wasted cycle is energy drawn from a battery that might need to last a year. Every unnecessary instruction is heat generated in a package with no fan and no heatsink. The gap between what your code asks for and what your hardware can deliver is not a performance optimization. It is a design constraint.
A neural network inference pipeline is, at its core, millions of multiply-accumulate operations on contiguous arrays. It is the ideal workload for vector hardware. But if your framework, your compiler, or your abstraction layer feeds those arrays to the vector unit one element at a time, you are running a race car in first gear. The engine is capable. The driver is not asking for what it can give.
This is why edge AI accelerator software is hard. Not because the algorithms are complex. Because the distance between a correct implementation and an efficient one is enormous, and every layer of abstraction is a place where performance can quietly disappear.
The lesson that keeps teaching itself
The turbopuffer team put it best: zero-cost abstractions do not absolve you from practicing mechanical sympathy.
Mechanical sympathy. The term comes from racing. A driver who understands what the engine is doing. Not just the steering wheel and the pedals, but the physical reality of combustion and traction and thermal limits. That driver will extract more from the car than one who treats it as a black box. Not because the black box is broken. Because it hides the information you need to make good decisions.
The same is true of software. A Rust iterator is not broken. A C loop that the compiler refuses to vectorize is not broken. A high-level framework that abstracts away memory layout is not broken. They all produce correct results. They all compile efficiently in isolation. And they all, in the ways that matter, can prevent the hardware from doing what it was designed to do.
The fix is not to abandon abstractions. It is to know where they cost you. Profile first. Read the assembly. Understand what the hardware can do that your code is not asking for. And when the gap matters. When you are counting milliwatts, or milliseconds, or millijoules. Close it.
The code is not wrong. The hardware is not slow. The assumption that the compiler will bridge the gap is where the performance lives.
And on edge hardware, that assumption can cost you 9x.
Source code for all benchmarks in this post is available at github.com/sunilsomarajan/edge-lab/benchmarks/bm25.